Mastering Experience Sampling Data Analysis in R: A Starting Guide

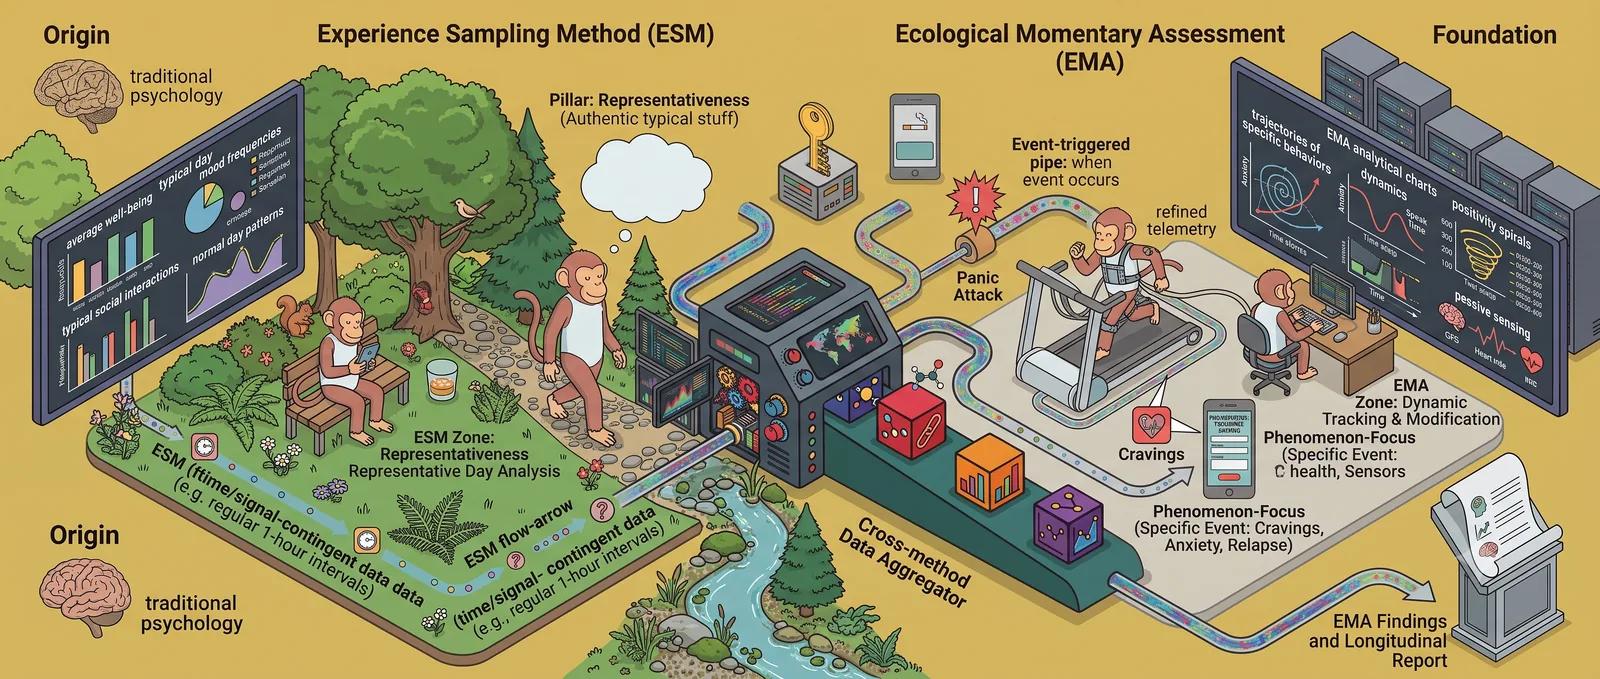
Analyzing experience sampling (ESM) and ecological momentary assessment (EMA) data can be complex due to its longitudinal nature and the intricacies of within-person and between-person variations. R, being a powerful statistical programming language, is equipped with a range of packages that can handle such complexities. Here's a resource guide on how to use R and its packages to analyze experience sampling data, along with some R code snippets for common tasks.
Getting Started with R
Before diving into the analysis, you should have R and RStudio installed on your computer. RStudio is an integrated development environment (IDE) that makes using R much easier. You can download R from The Comprehensive R Archive Network (CRAN) and RStudio from the RStudio website.
Essential R Packages for Experience Sampling Data
-
lme4: For mixed-effects models, which are often used in experience sampling data analysis to account for the nested structure of the data (observations nested within individuals).
install.packages("lme4") library(lme4) -
nlme: An alternative to lme4 that also allows for modeling nested data with slightly different syntax and functionalities.
install.packages("nlme") library(nlme) -
tidyverse: A collection of R packages designed for data science, making data manipulation, visualization, and analysis more user-friendly.
install.packages("tidyverse") library(tidyverse) -
multilevel: Specifically designed for multilevel (hierarchical) data, which is common in experience sampling studies.
install.packages("multilevel") library(multilevel) -
psych: Useful for descriptive statistics and psychometric analyses.
install.packages("psych")
library(psych)
Example R Code for Experience Sampling Data Analysis
Data Preparation
# Load the tidyverse package for data manipulation
library(tidyverse)

# Read your experience sampling dataset
es_data <- read_csv("your_data.csv")

# View the first few rows of the dataset
head(es_data)
Descriptive Statistics
# Using the psych package for descriptive statistics
library(psych)

# Get descriptive statistics for your variables
describe(es_data)
Mixed-Effects Model
# Load the lme4 package
library(lme4)

# Fit a mixed-effects model
# Replace 'outcome_variable' with your dependent variable
# Replace 'time_variable' and 'predictor_variable' with your time and main predictor variables
# (1 | subject_id) accounts for the random intercepts for each subject

mixed_model <- lmer(outcome_variable ~ time_variable + predictor_variable + (1 | subject_id), data = es_data)

# View the summary of the mixed model
summary(mixed_model)
Visualizing Data
# Using ggplot2 from the tidyverse package for visualization
library(ggplot2)

# Create a plot of the outcome variable over time for each subject
ggplot(es_data, aes(x = time_variable, y = outcome_variable, group = subject_id, color = subject_id)) +
  geom_line() +
  theme_minimal() +
  labs(title = "Experience Sampling Data Over Time", x = "Time", y = "Outcome Variable")
Exporting Results
# Export the model summary to a CSV file
write.csv(summary(mixed_model)$coefficients, file = "model_summary.csv")
Further Resources
For a more detailed and comprehensive guide, you can refer to the following:
- CRAN Task View: Analysis of Ecological and Environmental Data
- R documentation and vignettes for each package (e.g., ?lme4, vignette("lme4"))
- Online courses and tutorials on platforms like Coursera, Udemy, or DataCamp that offer specific courses on R for longitudinal data analysis.
- Books like "Applied Longitudinal Data Analysis: Modeling Change and Event Occurrence" by Judith D. Singer and John B. Willett, which includes examples in R.
Remember to consult the documentation for each R package for specific functions and additional options, and always ensure your code and statistical models are suited to the hypothesis and structure of your dataset.