Mobile charts for participant progress
What These Charts Show
This guide covers the charts in Participant Feedback, which plot scored answers over time and are opened from the survey card. For a chart that sits inside a survey as a question, see Mobile charts within surveys.
A feedback chart plots a participant's own scored answers day by day, and they can open it at any point during the study from the ExpiWell mobile app. You choose which scored questions it draws on, how many days it covers, and the range of its axis.
This is most useful when the participant seeing their own trend is part of the design — tracking progress across a study, or an ecological momentary intervention (EMI) where self-knowledge is the point.
Step 1: Build the questions you want to chart and switch on Score in each one. A score box appears to the right of every response choice.
Only questions with scoring enabled can be charted, and not every question type offers scoring — a Multiple Selection question has no Score section at all. Check that the question you want to chart can be scored before you build it.
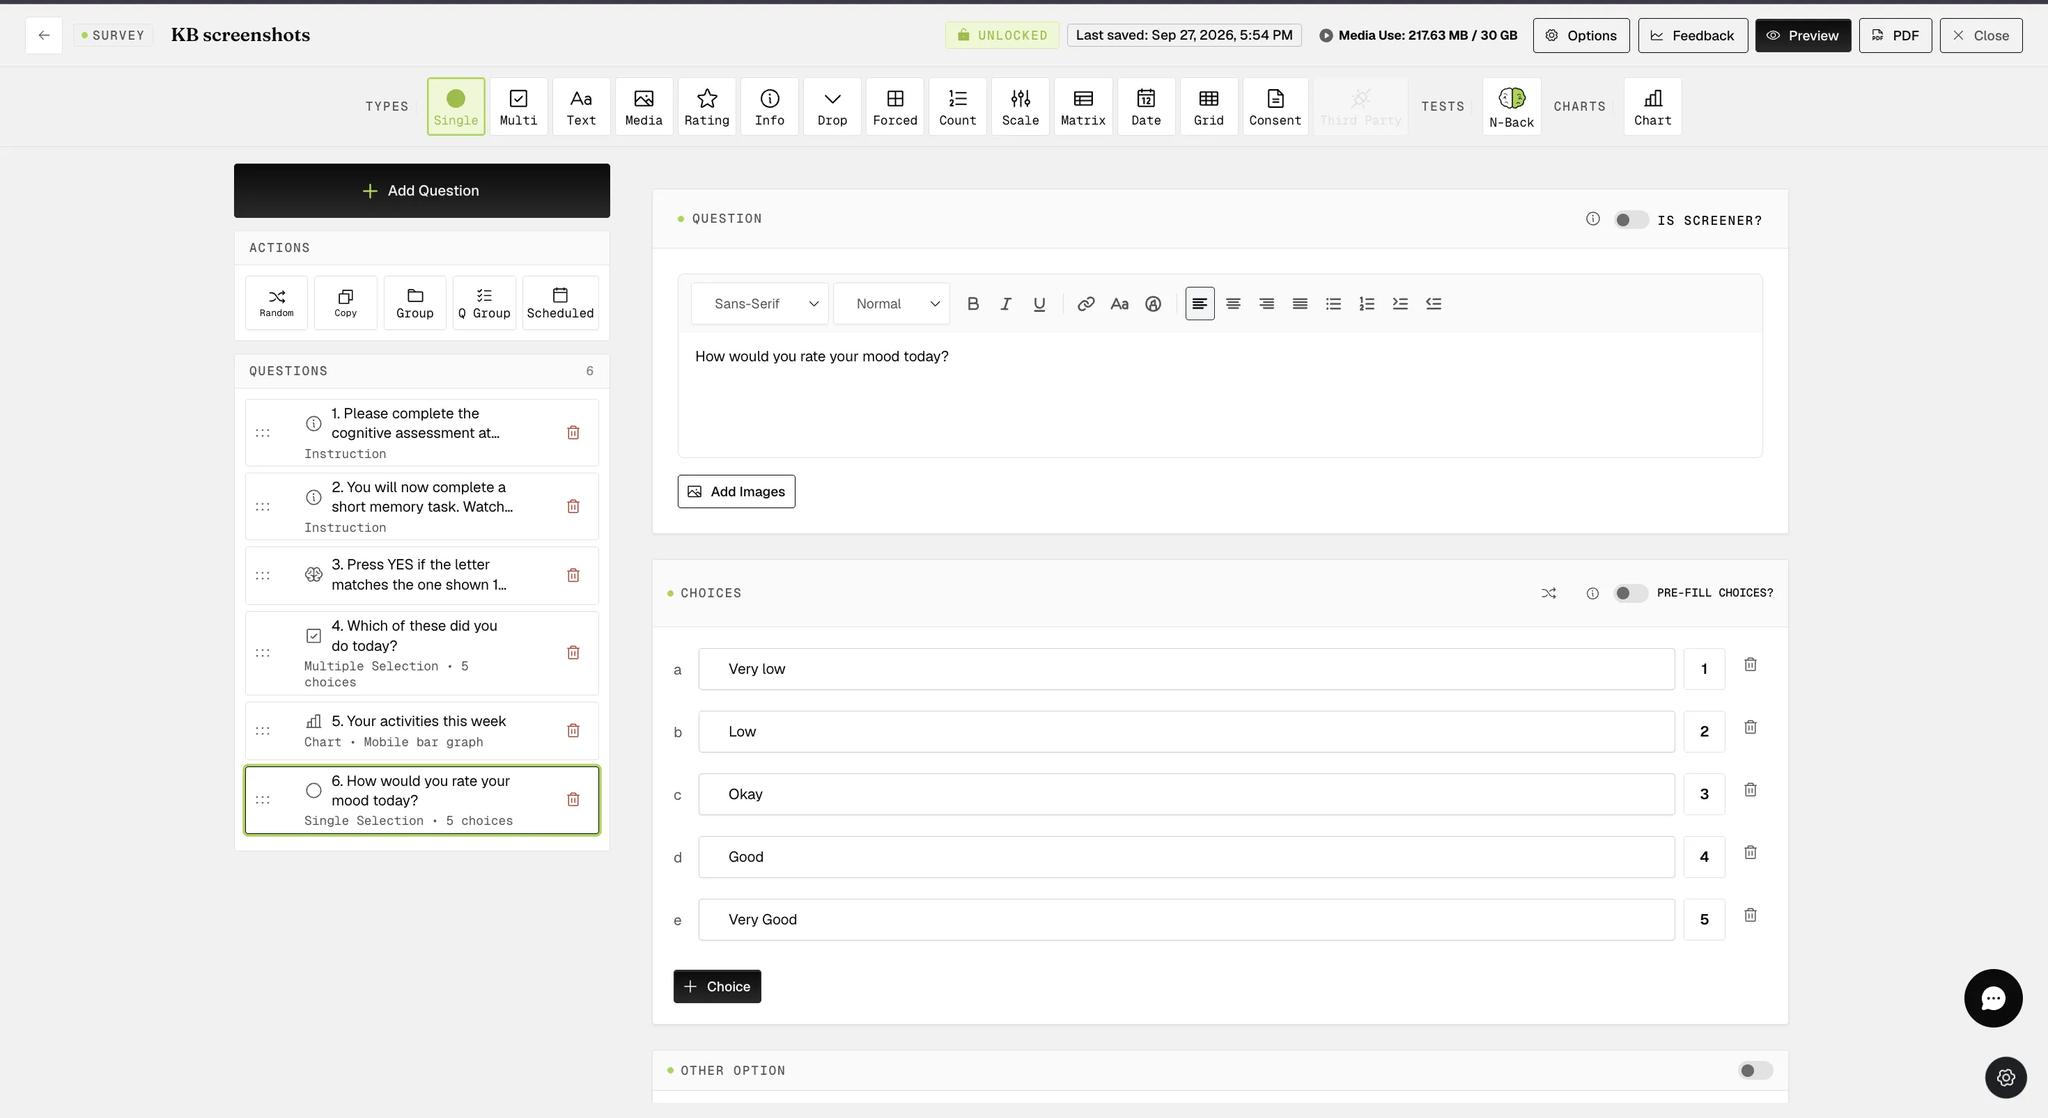
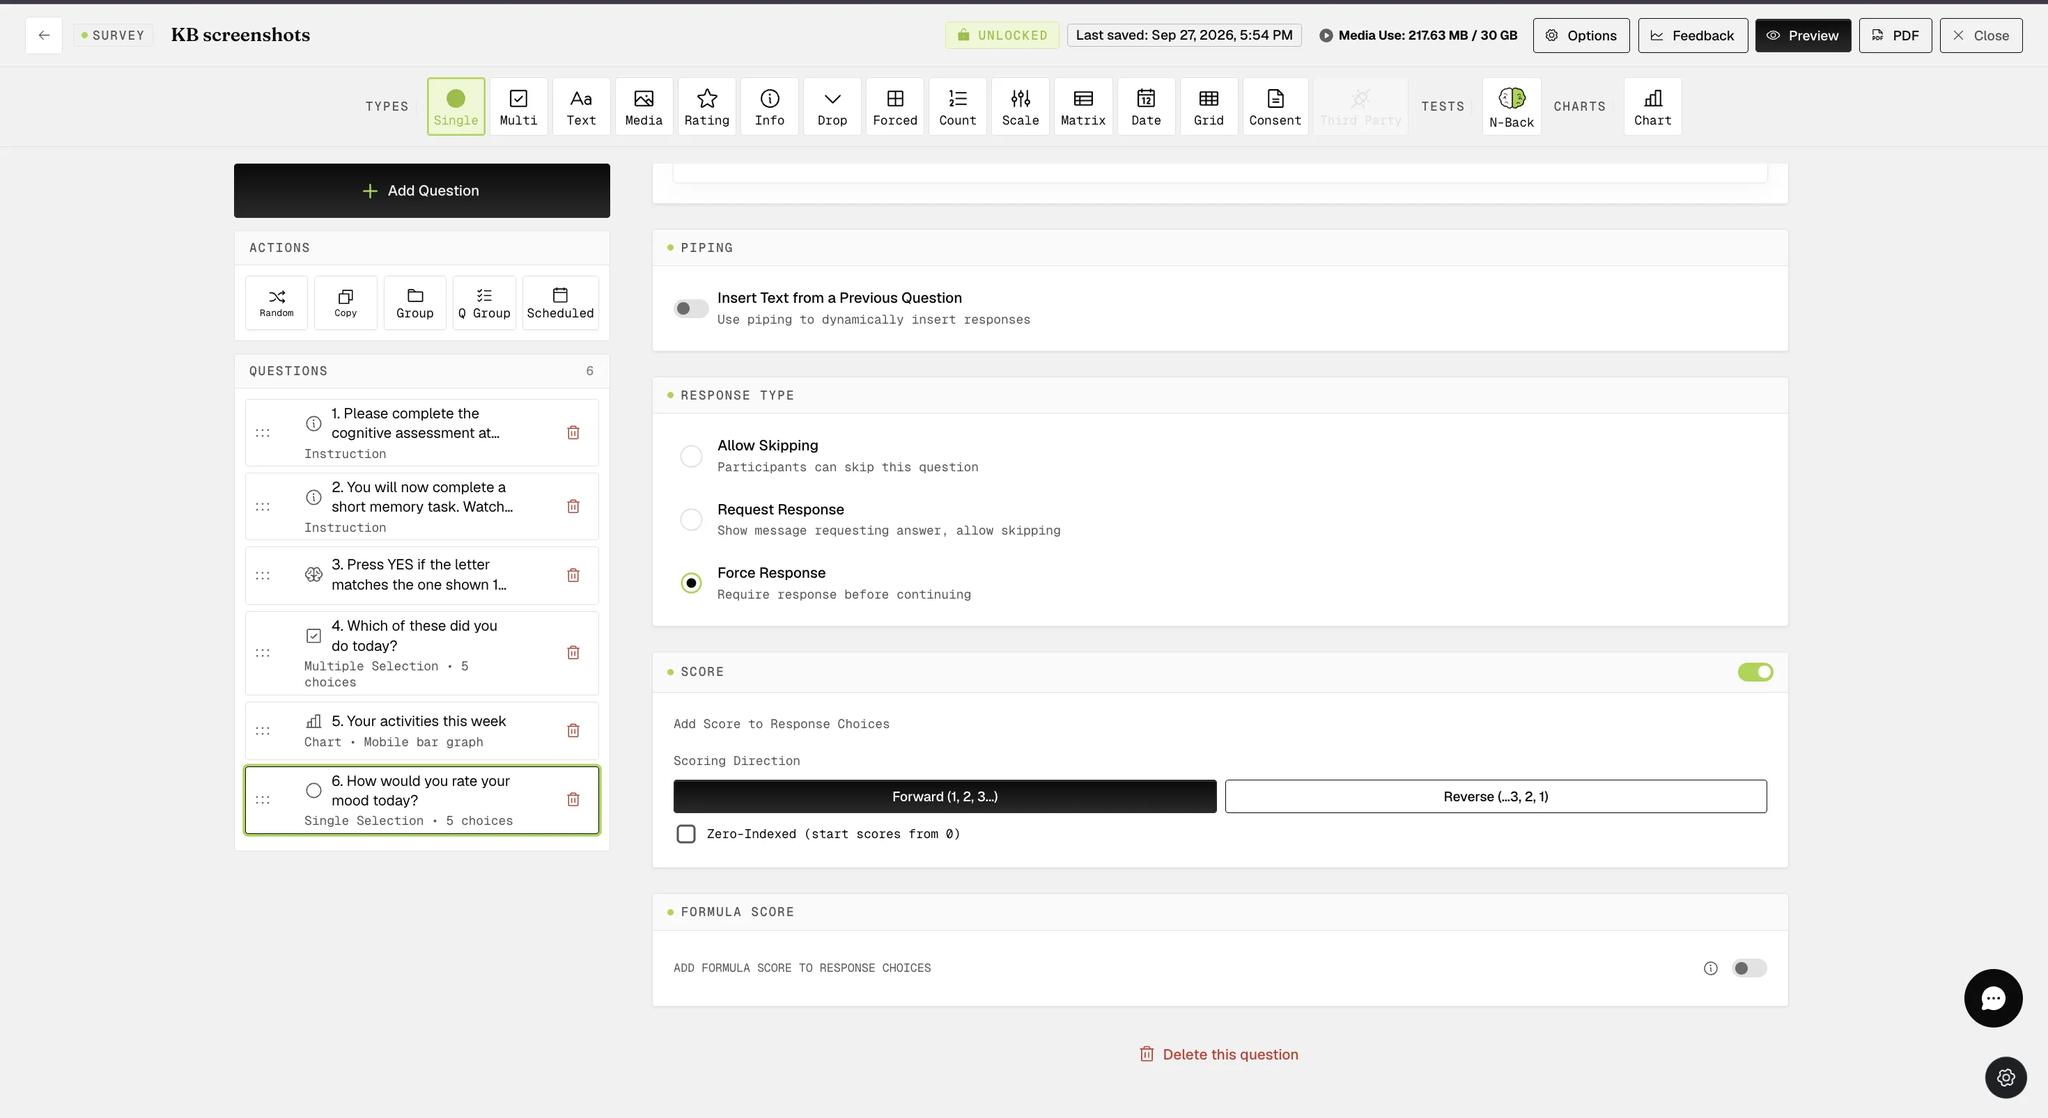
The Score panel further down the question controls how those numbers are assigned. Scoring Direction runs them forward (1, 2, 3…) or in reverse (…3, 2, 1), which is useful for negatively worded items. Zero-Indexed starts the scale at 0 instead of 1.
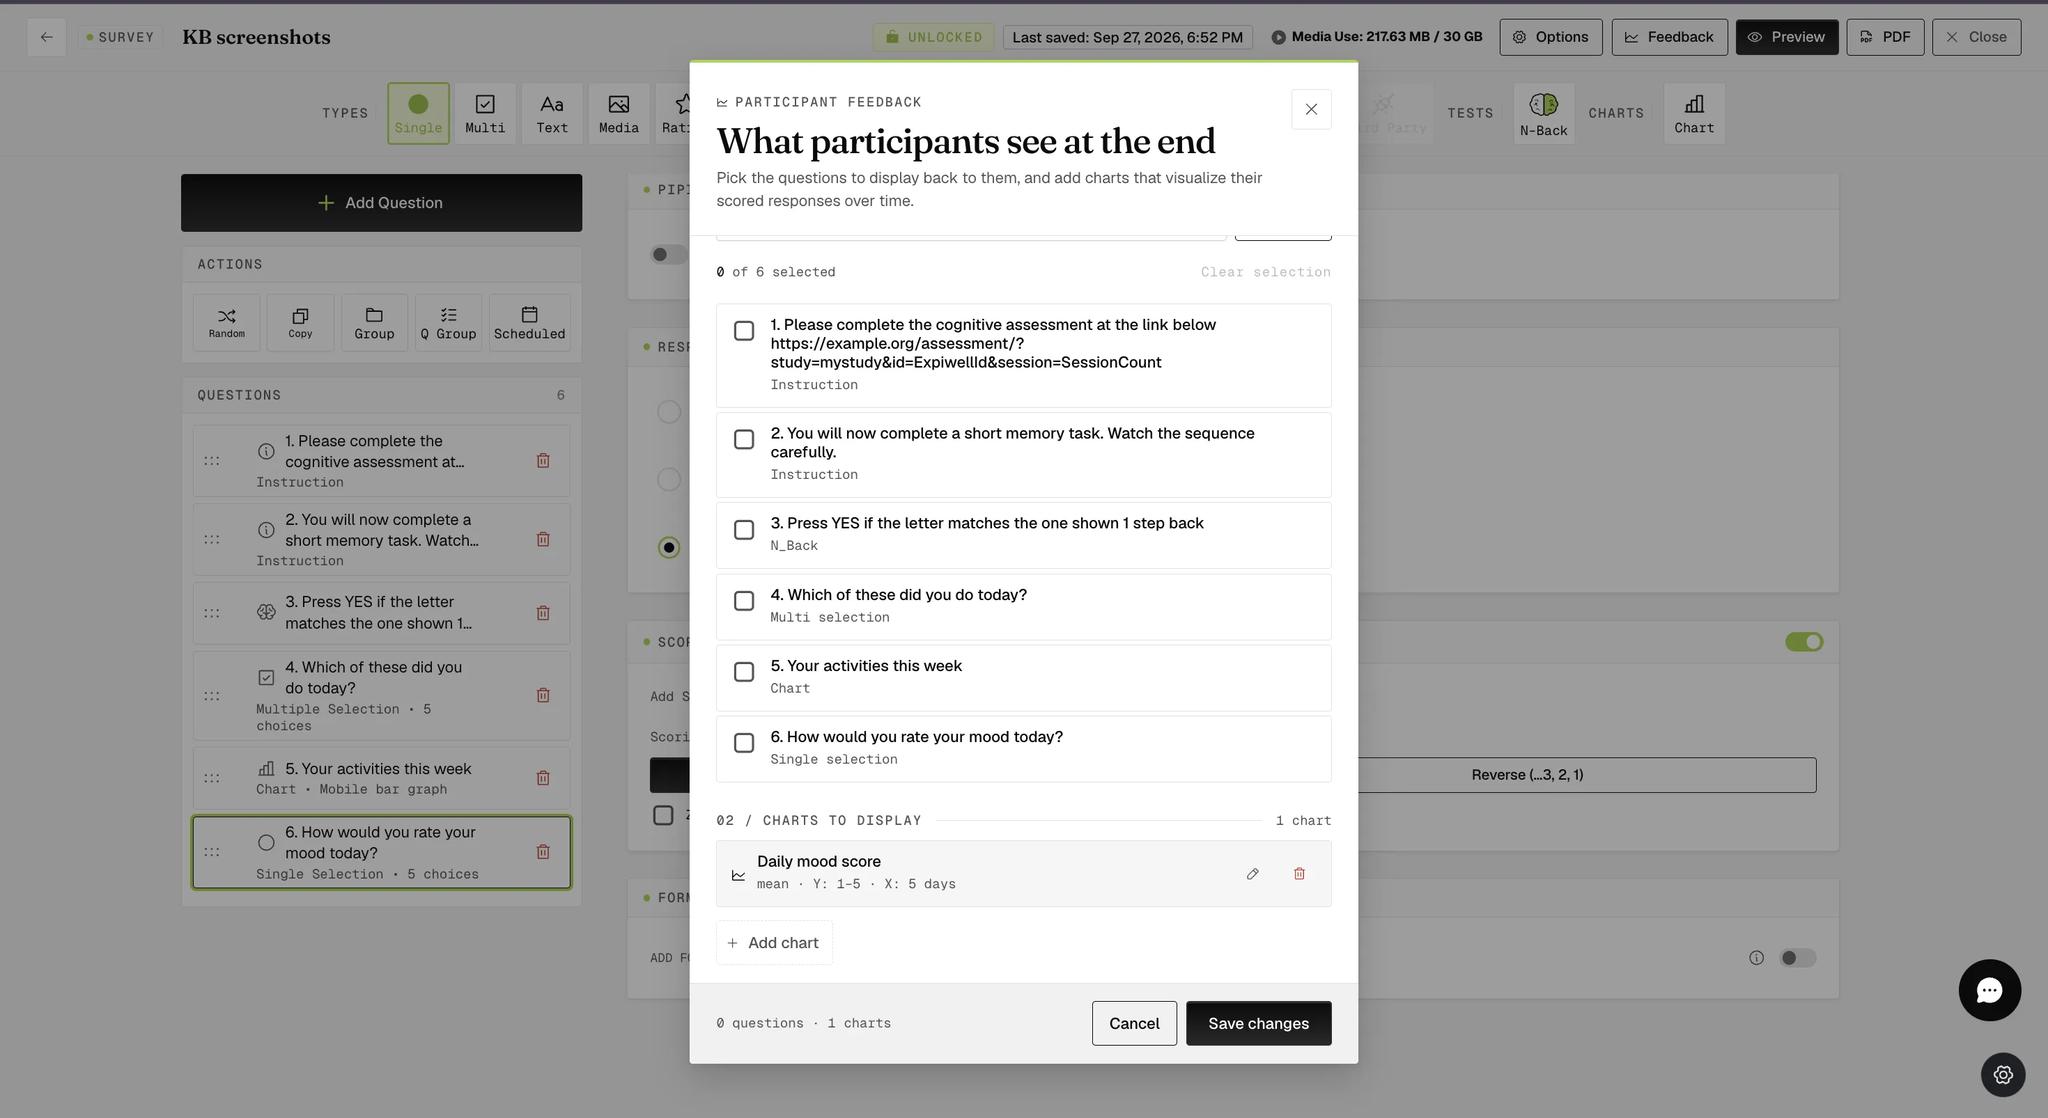
Step 2: Click Feedback in the survey builder's top bar. This opens Participant Feedback, which has two parts: the questions to show back to participants, and the charts to display to them.
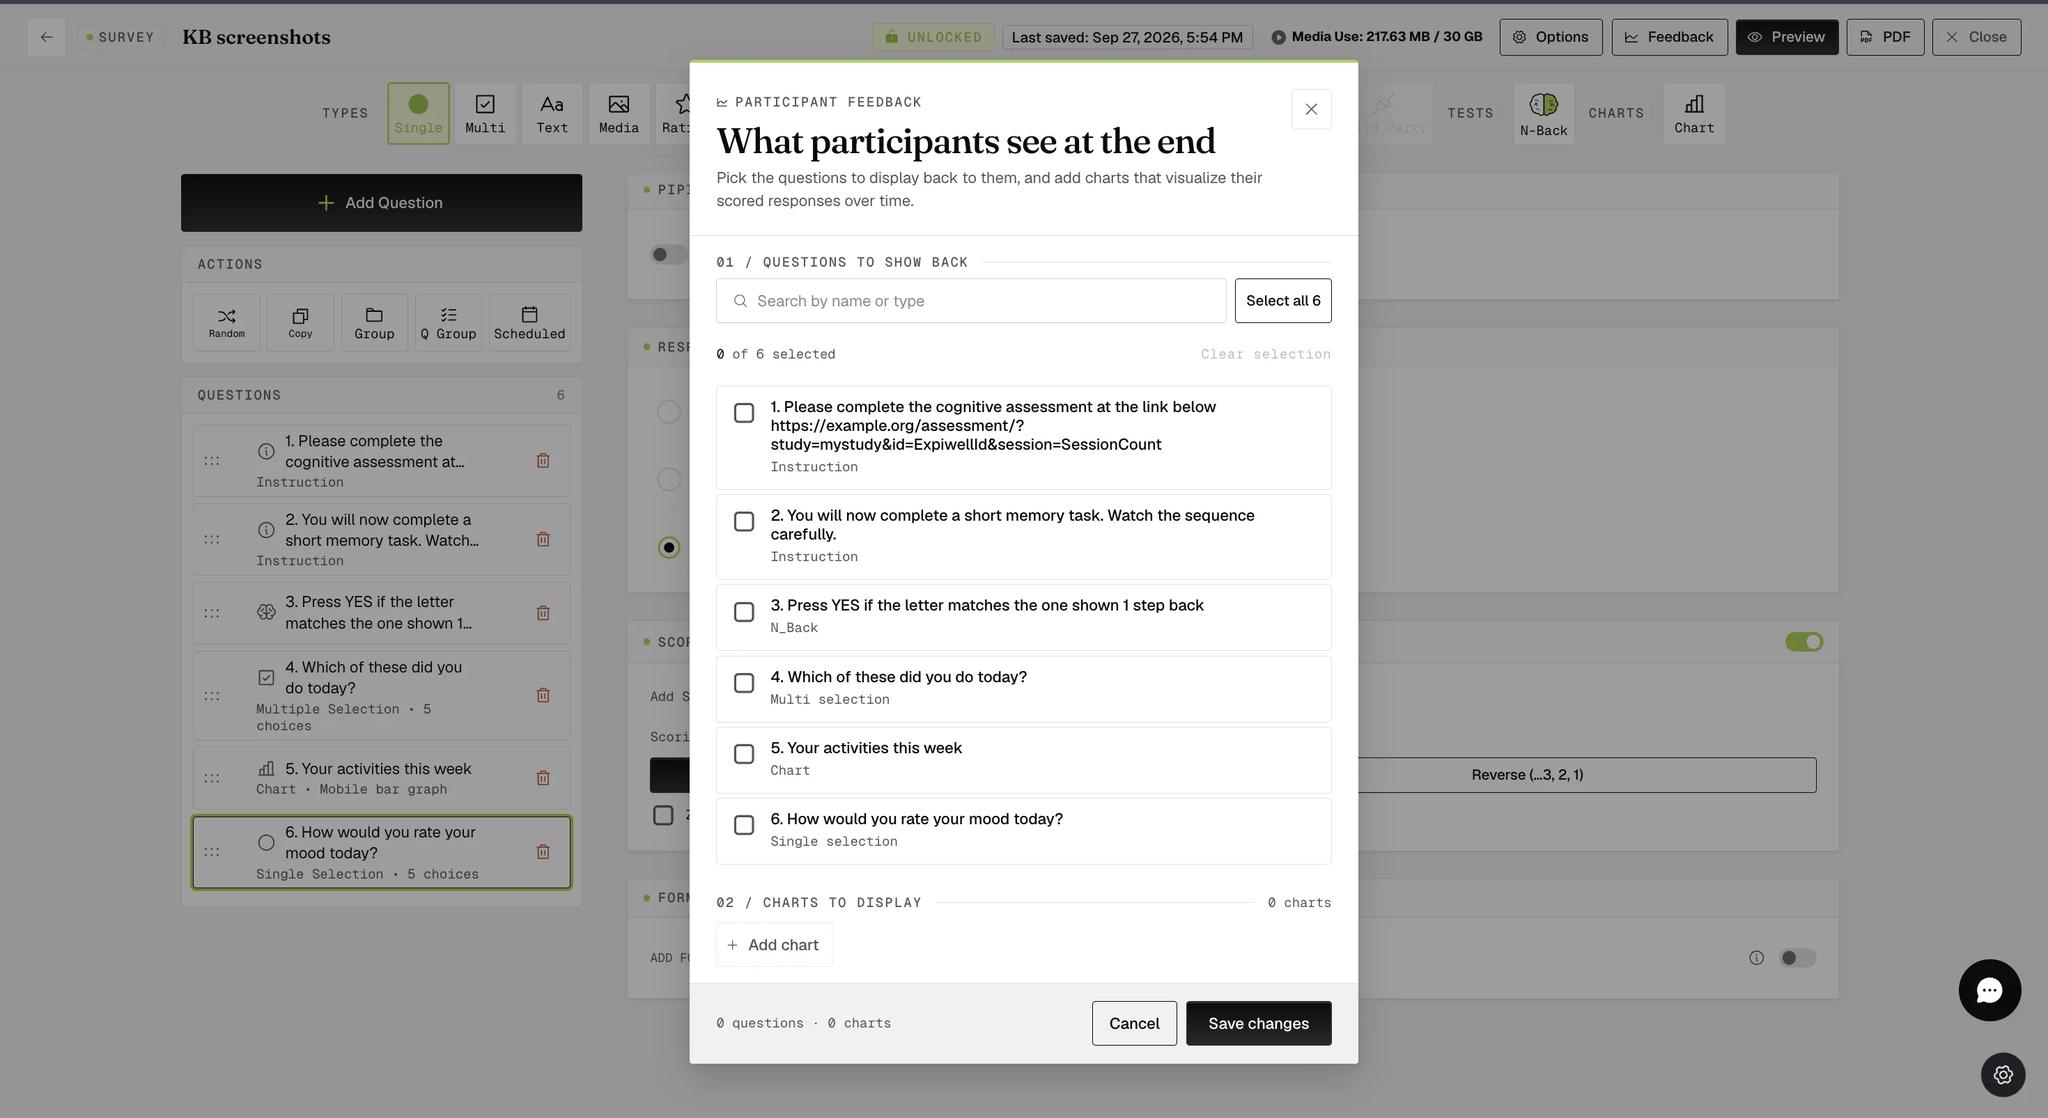
Questions to show back and Charts to display are separate features that share this one modal. This guide covers the charts; showing responses back is covered in Participants viewing past responses.
Step 3: Click Add chart and set it up:
-
Title — the heading participants see above the chart.
-
X-axis · Days — how many days of history to plot.
-
Equation (Y) — Mean for the average score, or Sum for the total.
-
Y-axis Range — the lowest and highest values on the axis. Match this to your scoring, so a question scored 1 to 5 gets a range of 1 to 5 rather than the default.
-
Source Questions — which scored questions feed the chart. Only questions with Score enabled appear here.
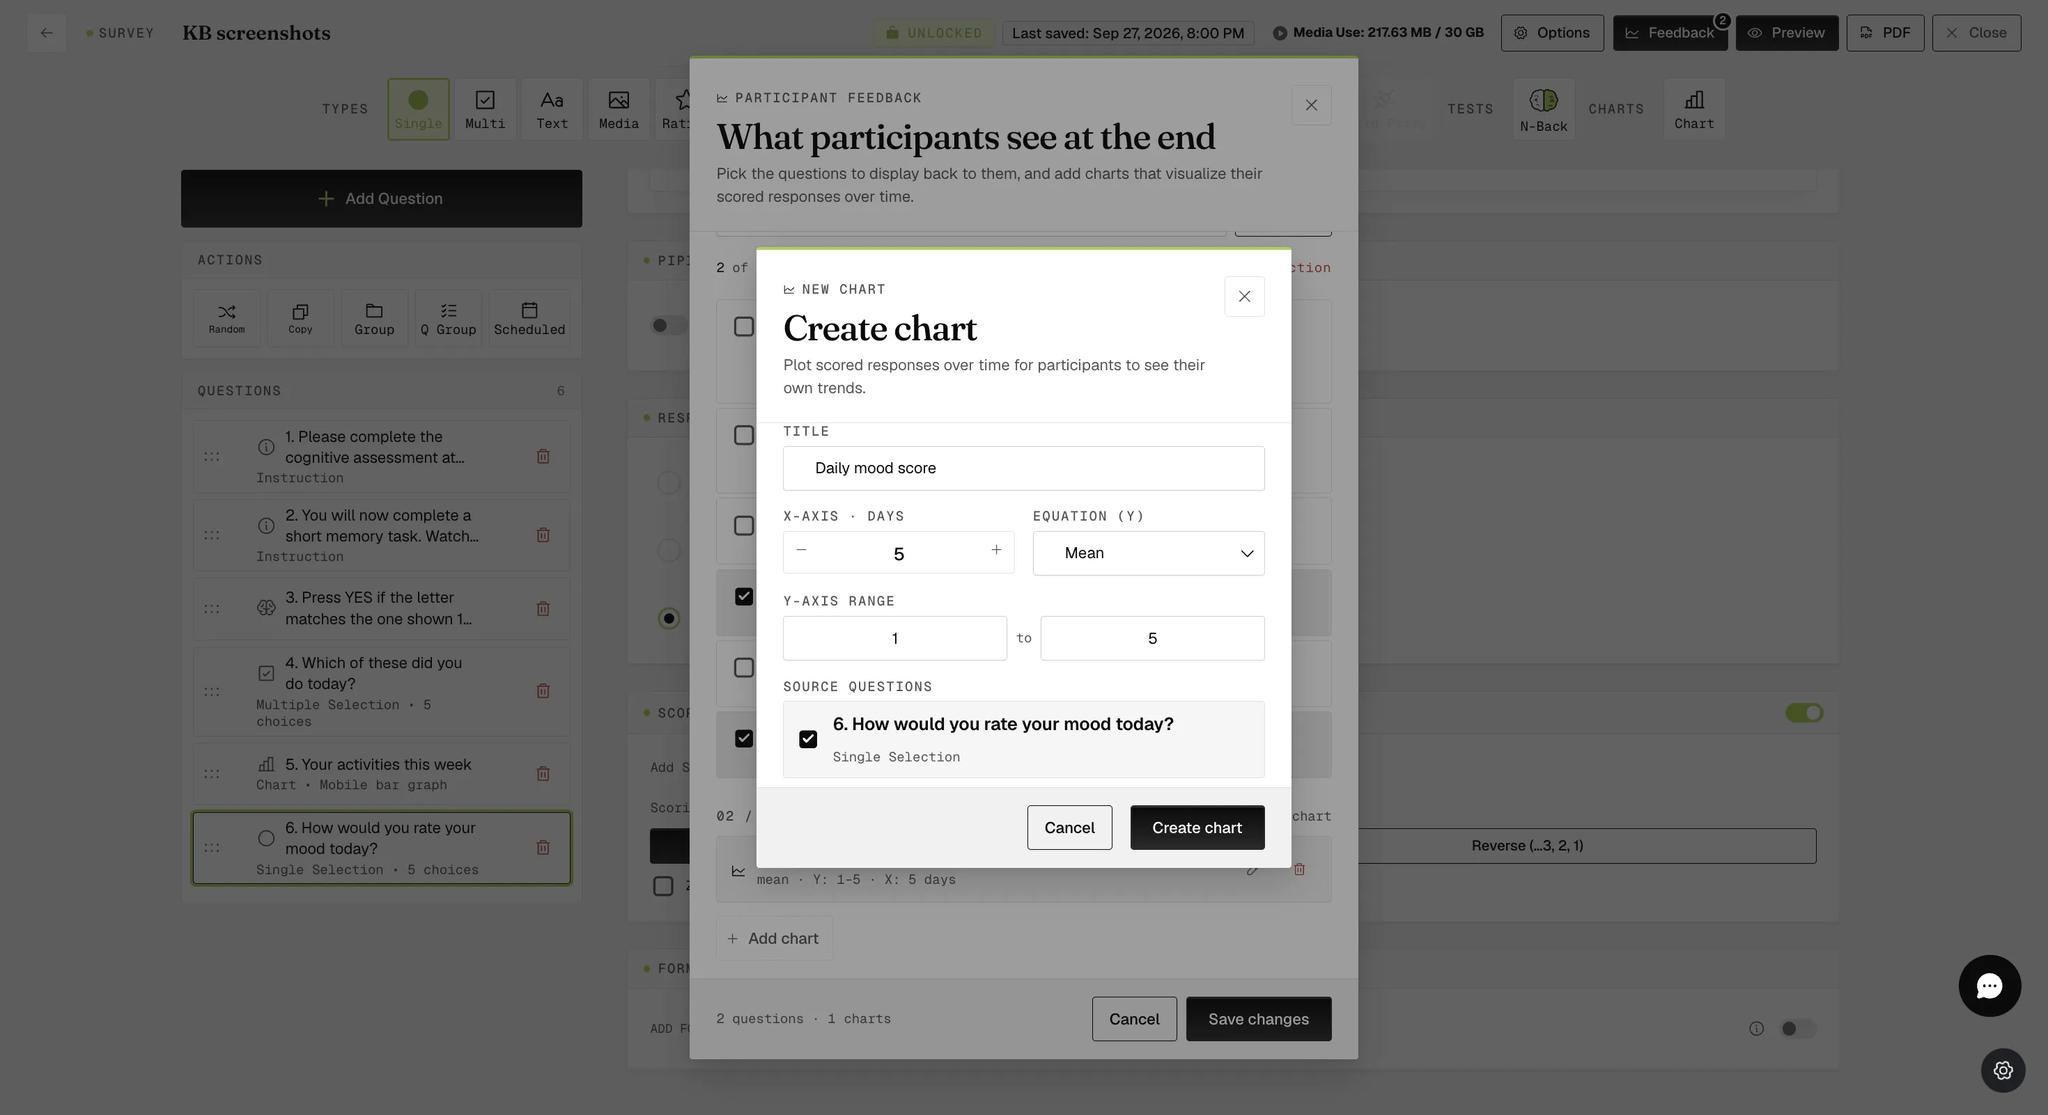
Click Create chart. It appears under Charts to display with a summary of its settings, and you can edit or delete it from there. Add as many charts as you need, then click Save changes.
Where Participants Find the Chart
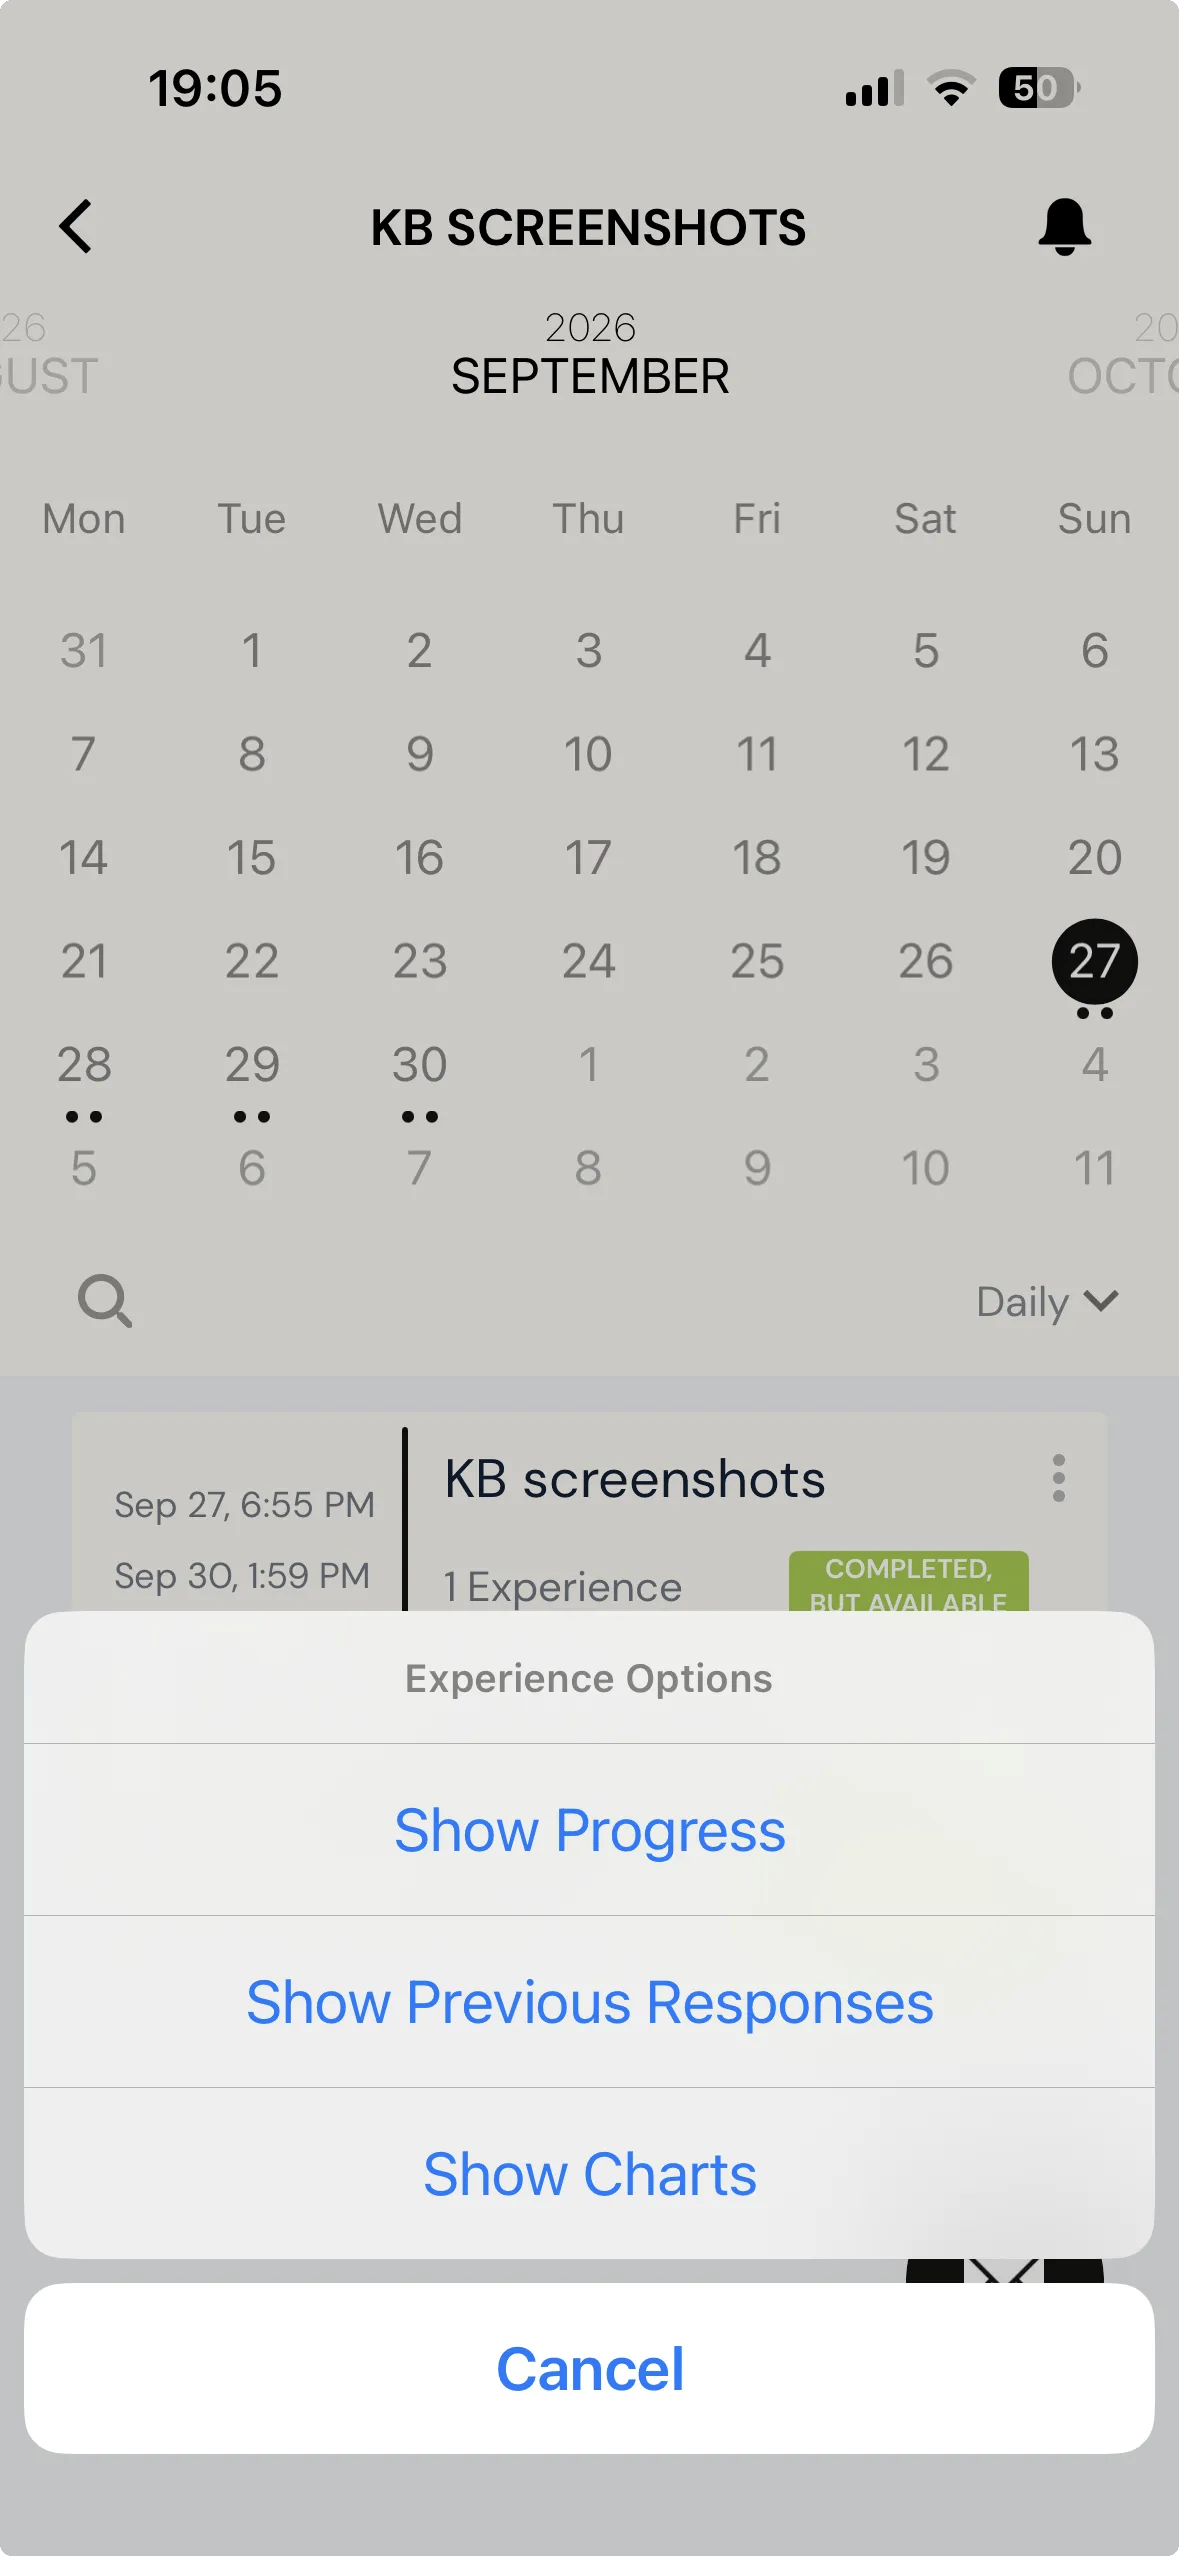
The chart does not appear inside the survey. Participants reach it from the survey card in the mobile app: tap the three dots on the right, then Show Charts.
Every chart you set up appears here, plotted against the days you configured.
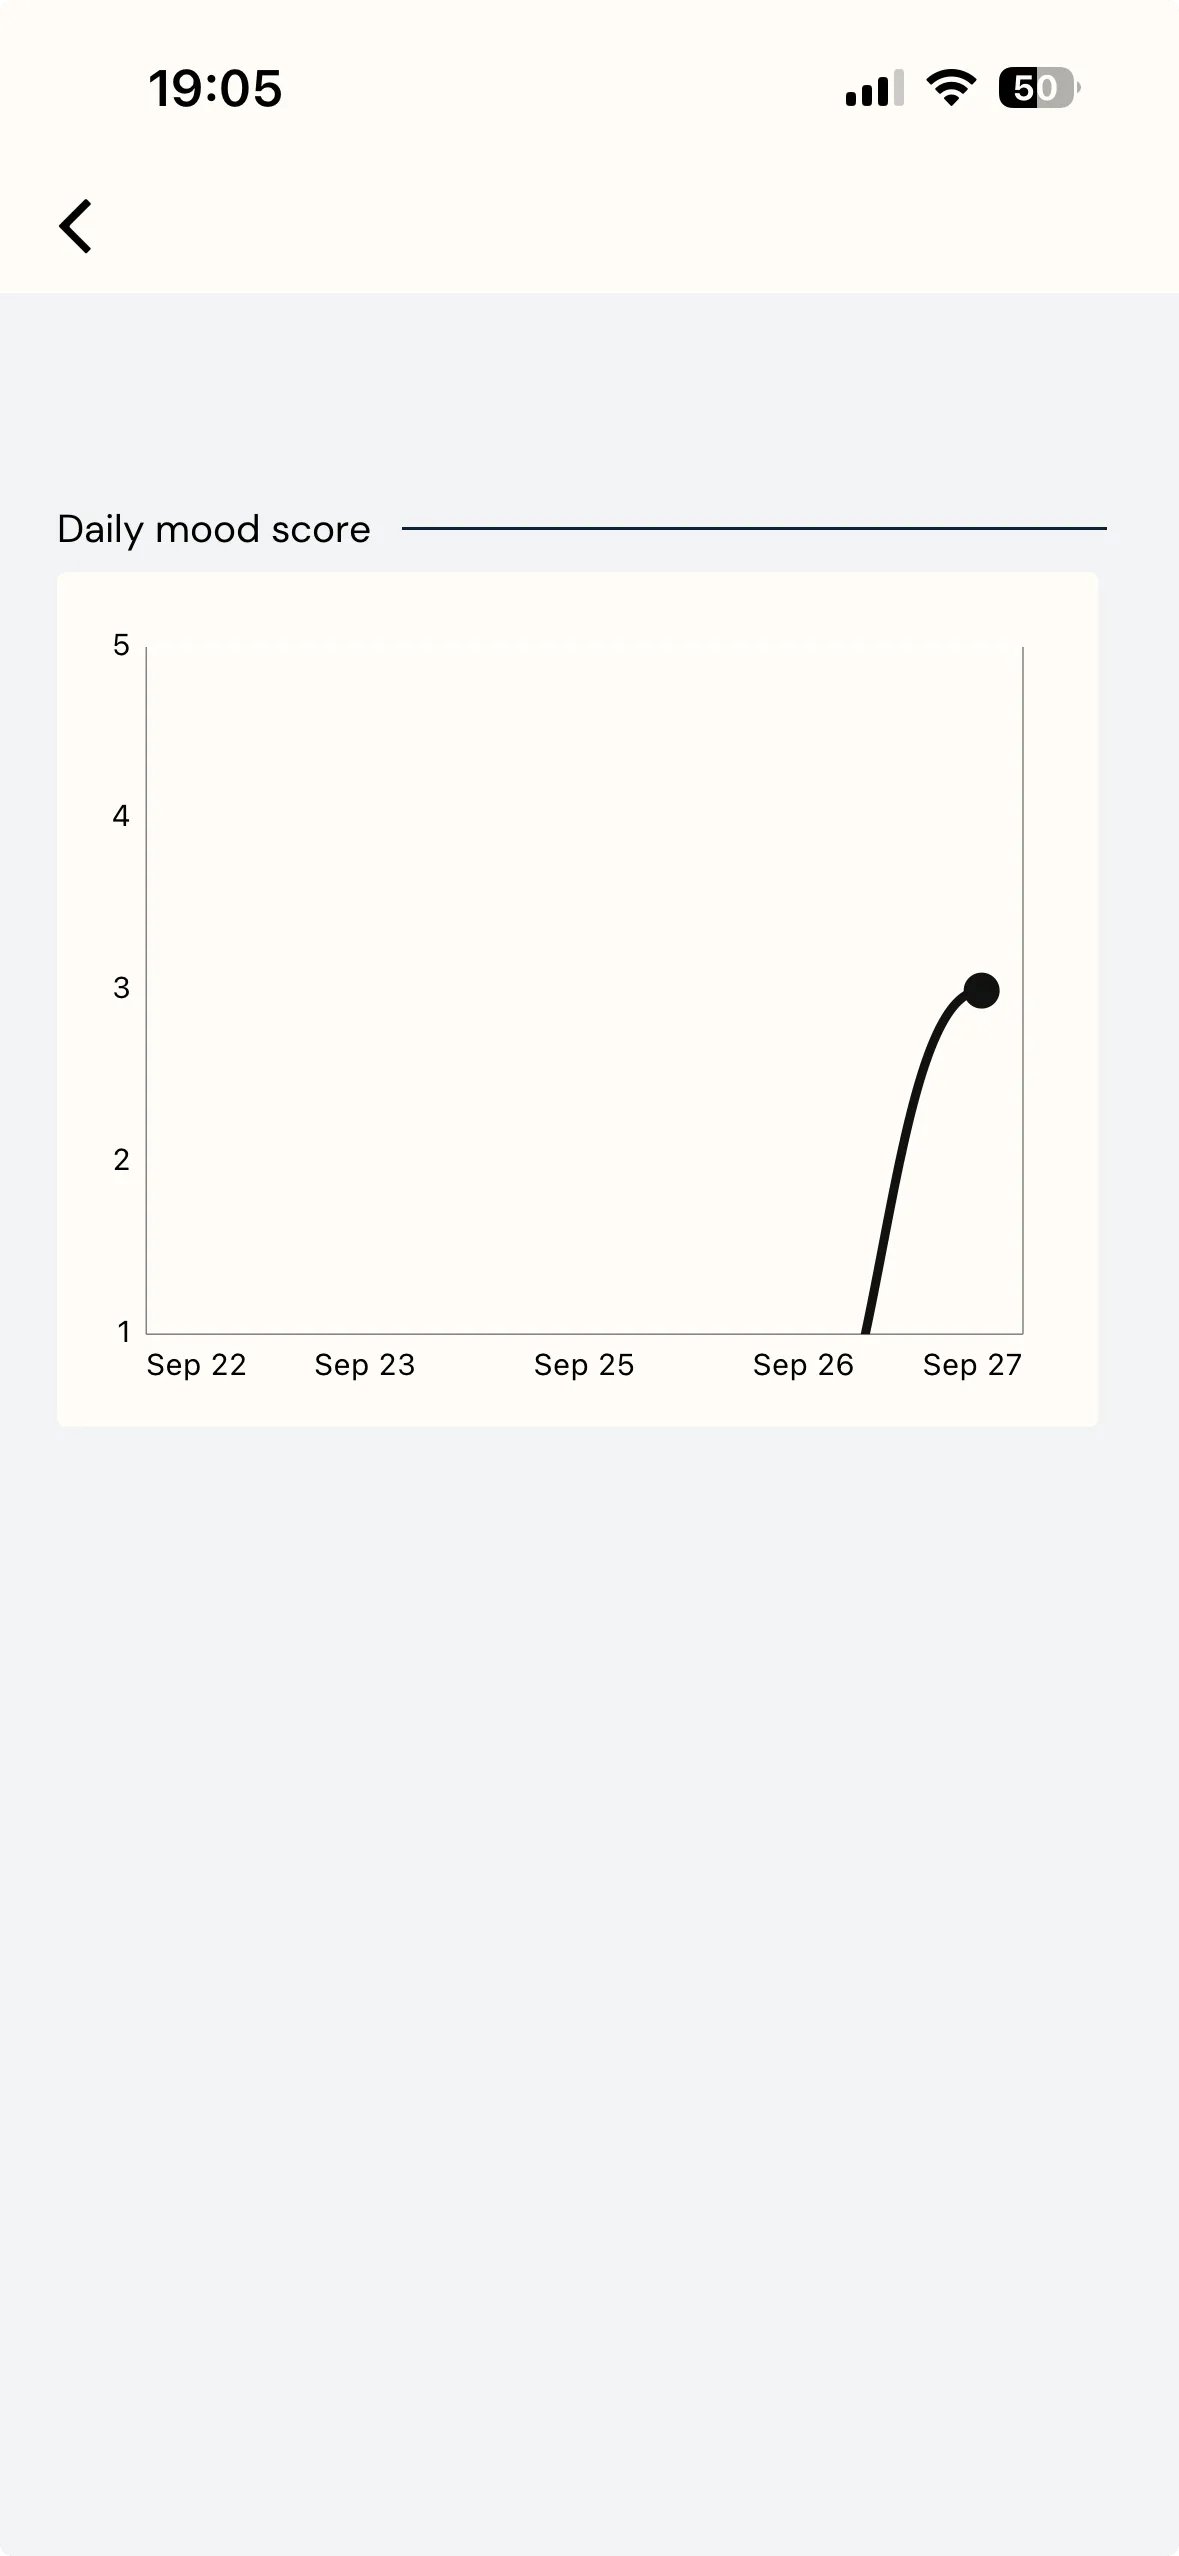
The chart plots one point per day from the participant's own scored answers, so it only becomes meaningful once they have responded on several days.
For further inquiries, please reach out to help@expiwell.com